This type of Mathematica graph is primarily used for implicit functions, trigonometric functions, and vertical lines.
Click Questions › Create.
The Question Editor opens.
In Name, type a name for the question.
In Question, type your question.
Use the answer placeholder string
<_>to specify where the answer box should be displayed.Add WAPlot tags to the question, answer, or solution field of a question.
If a WAPlot image is used in the answer field, the question mode must be multiple-choice, and there cannot be linebreaks in the WAPlot code. WAPlot images cannot be placed in assignment descriptions.
<waplot type='MathematicaSyntax'> </waplot><waplot type='MathematicaSyntax'> ContourPlot[ (x - 1)^2/36 + (y + 2)^2/4 == 1, {x, -5,7}, {y, -4,0}, Frame->False, Axes -> True, ContourStyle->Directive[Purple, Thick], AspectRatio->Automatic, PlotRange->{{-10.5,10.5}, {-5,5}}, AxesLabel->{x, y} ] </waplot><waplot type='MathematicaSyntax' alt='ellipse with form (x - 1)^2/36 + (y + 2)^2/4 = 1'>Make sure the content of the alternative text is appropriate to the pedagogy of your question.
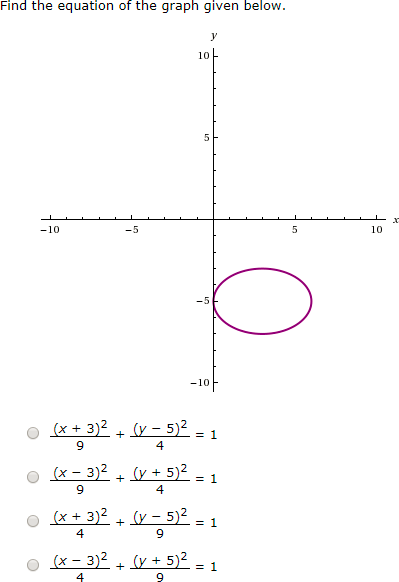
Graphing a Contour Plot The following table summarizes an actual question. QID 3969543 Name Template2 6.WAPLOT.06. Mode Multiple-Choice Question Find the equation of the graph given below. <figure> <waplot type='MathematicaSyntax' alt='ellipse with form (x - 1)^2/36 + (y + 2)^2/4 = 1'> ContourPlot[ (x - 1)^2/36 + (y + 2)^2/4 == 1, {x, -5,7}, {y, -4,0}, Frame->False, Axes->True, AxesLabel->{x, y}, PlotRange->{{-10.5,10.5}, {-5,5}}, AspectRatio->Automatic, ContourStyle->Directive[Purple, Thick] ] </waplot> </figure> <_> Answer <watex>\[\frac{(x - 1)^2}{36} + \frac{(y + 2)^2}{4} = 1 \]</watex> <watex>\[\frac{(x + 1)^2}{36} + \frac{(y - 2)^2}{4} = 1\]</watex> <watex>\[\frac{(x - 1)^2}{4} + \frac{(y + 2)^2}{36} = 1\]</watex> <watex>\[\frac{(x + 1)^2}{4} + \frac{(y - 2)^2}{36} = 1\]</watex> Display to Students 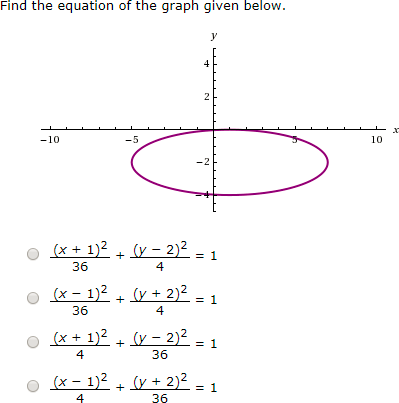 Graphing a Randomized Contour Plot The following table summarizes an actual question. Click the link to duplicate the example as a question in WebAssign. You must be logged into WebAssign for a template link to function. QID 3979381 Name Template2 6.WAPLOT.07. Mode Multiple-Choice Question <eqn> # ellipse with form (x - $h)^2/$aa + (y + $k)^2/$bb = 1 ($h, $k) = pick(2, 1..5); ($a, $b) = sort{$b <=> $a} pick(2, 2..5); $aa = $a**2; $bb = $b**2; # plotrange variables for graph $xmin = $h - $a; $xmax = $h + $a; $ymin = -$k - $b; $ymax = -$k + $b; ''</eqn> Find the equation of the graph given below. <figure> <waplot type='MathematicaSyntax' alt='ellipse with form (x - $h)^2/$aa + (y + $k)^2/$bb = 1'> ContourPlot[ (x - $h)^2/$aa + (y + $k)^2/$bb == 1, {x, $xmin, $xmax}, {y, $ymin, $ymax}, Frame->False, Axes -> True, AxesLabel->{x, y}, PlotRange->{{-10.5,10.5}, {-10.5,10.5}}, AspectRatio->Automatic, ContourStyle->Directive[Purple, Thick] ] </waplot> </figure> <_> Answer <watex>\[\frac{(x - <EQN $h>)^2}{<EQN $aa>} + \frac{(y + <EQN $k>)^2}{<EQN $bb>} = 1 \]</watex> <watex>\[\frac{(x + <EQN $h>)^2}{<EQN $aa>} + \frac{(y - <EQN $k>)^2}{<EQN $bb>} = 1\]</watex> <watex>\[\frac{(x - <EQN $h>)^2}{<EQN $bb>} + \frac{(y + <EQN $k>)^2}{<EQN $aa>} = 1\]</watex> <watex>\[\frac{(x + <EQN $h>)^2}{<EQN $bb>} + \frac{(y - <EQN $k>)^2}{<EQN $aa>} = 1\]</watex> Display to Students