WebAssign Instructor Help
- Sign In / Account
Under Interim / Final Grade, select the information you want your students to see.
Student View Items
GradeBook Settings
Overall Grade
[Letter] Grade, Final Score, Histogram
Category Grades
Final Score
Class Statistics
Class Average, Minimum, Maximum, St Dev
When all items are shown, your students see three tables with their grade, class grades, and scores on individual assignments.
- Total Grade
Student's letter or pass/fail grade and numeric score.
To view your grading scale, click Grading Scale.
- Class Grades
The minimum grade, class average, your student's grade, maximum grade, and standard deviation of grades in your class.
To view this data in a graph, click Graph.
- Scores
Click a tab in the Scores table to view more information.
- Scores
Scores for each assignment type.
To see scores for assignments in a category, and how they affect your student's grade, click
 .
.- Raw Scores
Scores without weighting or dropping assignments.
To see scores for assignments in a category, click
.- Class Scores
Your student's score, the class average, minimum score, maximum score, and standard deviation for categories and assignments.
To see scores for assignments in a category, click
. To view data in a graph, click Graph.
Under Raw Scores, select which statistics to show your students and when they are shown for each assignment or category.
Student View Items
GradeBook Settings
My Scores
Always shown for categories for which averages are calculated.
Class Statistics
Avg, Min, Max, St Dev, Histogram
For each assignment or category, the selected statistics can be shown both before and after assignment due dates (Always), only after assignment due dates (After Due Date), or not at all (Never).
When all items are shown, your students see a table with individual scores and class statistics for the assignments and categories included in the GradeBook.
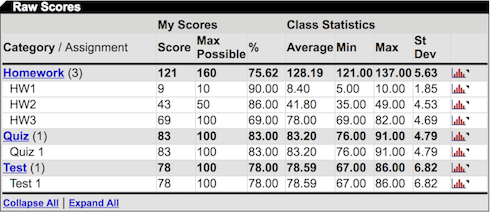
The Raw Scores table does not reflect weighting or dropped assignments.
Category / Assignment
My Scores
Class Statistics
Categories and assignments you chose to display. Click a category to show or hide its assignments.
- Score
Student's points earned.
- Max Possible
Available points.
- %
(Score ÷ Max Possible) × 100
Mean, minimum, maximum, and standard deviation of class scores. Click

to see the score distribution for the class.
Click Next.