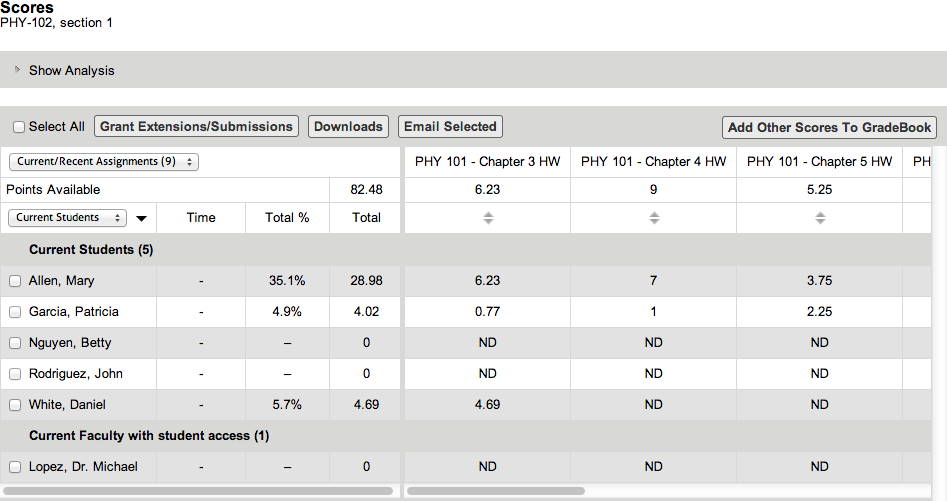
- Your assignments for the class are listed across the top of the table as column headings.
- Your students are listed on the left side of the table as row headings.
Each student's score for an assignment is displayed in the assignment's column in the student's row.
A red asterisk (*) beside a score indicates the score has been changed by the instructor.
Other row, column, and section headings are described in the following table.
Points Available | The total points that can be earned for each assignment. In the Total column, this is the sum of all possible points for all assignments. |
Time | The estimated amount of time each student spent online working on all of the assignments. |
Actions
You can perform a number of activities from the Scores page.
See other assignments |
| |
See other students |
| Drag the student list up or down. |
Sort the table | Click a sort arrow in the column heading. To sort by Total % or Total, click those column headings. | The sort arrows indicate the current sorting: ascending ( |
See individual question scores for an assignment | Click the assignment name. | |
See point distributions for an assignment | Click the total points available for the assignment. A histogram shows you the point distribution for your students. | |
See a score report for a specific student | Click the student's name. | |
See statistical analysis of class scores | Click Show Analysis. |
 ), descending (
 ), or not sorted (
 ).
).Analysis
The analysis section provides data that can be used to monitor the overall performance of the class. You can show or hide the analysis, and the analysis data can be displayed as either scores or percentages.
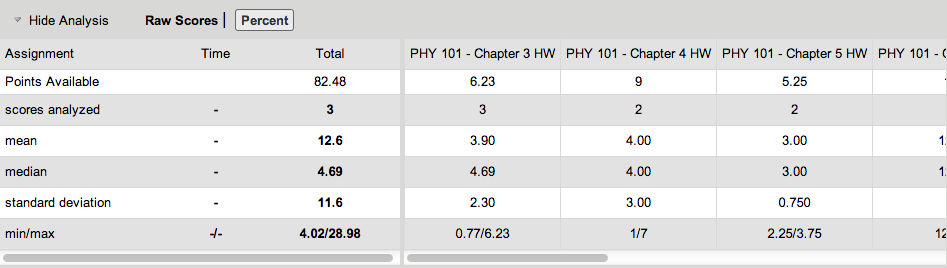
- Your assignments for the class are listed across the top of the table as column headings.
- Each statistical calculation is listed on the left side of the table as a row heading.
Other row and column headings are described in the following table.
Time | The estimated amount of time students spent online working on all of the assignments. |
Total | Summary score values for all assignments. |
scores analyzed | The number of submitted assignments with scores that were included in the calculations for mean, median, standard deviation, and min/max values. |
mean | The arithmetic mean of assignment scores for submitted assignments. |
median | The median score or time to complete submitted assignments. |
standard deviation | The standard deviation of scores or times for submitted assignments. Lower standard deviations mean the values are tightly clustered; higher standard deviations mean the values are more widely scattered. |
min/max | The lowest and highest scores or times to complete submitted assignments. |
- To show this section, click Show Analysis.
- To hide this section, click Hide Analysis.
- To view data as percentages, click Percent.
- To view data using the raw scores, click Raw.